Contact centers, like all businesses, are driven by performance. They can only succeed when everyone on the team understands how they are supposed to be contributing. Call center managers are responsible for making the decisions that determine whether or not everyone on the team is on the same page.
The only way to ensure every agent is focusing their efforts on the call center’s main objectives is to establish solid, unchanging call metrics that everyone can measure, analyze, and report on.
With so many metrics out there, it can be difficult for call centers to understand how they are performing. It can be even harder to know which metrics to employ to improve performance. In this article, we’re unpacking the call center customer service matrix: what it is, why it’s important, and how you can incorporate it into your contact center.
What Is the Call Center Customer Service Matrix?
The call center matrix is a group of metrics used to measure call center performance. These metrics are all interrelated; in our experience, improving one almost certainly improves another. But, as we mentioned earlier, with so many metrics to measure, how do we know which are most important?
At the end of the day, the call center’s success is determined by its bottom line. Any metric that doesn’t improve bottom-line performance isn’t worth measuring. And, some metrics have a greater effect on the bottom line than others.
In this article, we’re taking a look at the top 10 most important metrics call centers can measure. These are the components of the matrix that have the greatest impact on customer satisfaction and drive the most revenue for the contact center.
Top 10 Most Important Metrics
1. Customer Satisfaction
Customer satisfaction is one of the most important call metrics, but it is also one of the hardest to measure. The most common way to create a customer satisfaction score is to distribute a survey to your customers and ask them to share details about their experience; this is known as a post-call survey. This survey is typically given at some point after the call and includes several questions pertaining to call quality, resolution, and satisfaction.
Every metric in this list will influence your customer satisfaction score. Do everything you can to meet the needs of your customers in every call. Set benchmarks for this metric and regularly monitor your agents’ performance. And finally, utilize the customer satisfaction survey to know which of the following metrics you and your agents need to prioritize.
2. First Call Resolution
This measures whether or not a customer’s problem is resolved in the first call or not. You can improve your first call resolution score by training your agents to resolve a variety of issues, so that they don’t have to transfer customers to a supervisor, who are often the bottleneck in first call resolutions. Agents should also be trained to, if possible, stay on the phone with a customer until the customer feels like their problem is solved; this way the customer doesn’t have to call back multiple times for a single answer.
Consider also adding to the post-call survey with questions like, “Was your problem resolved?” Call center agents may think they’ve resolved an issue, but asking for the customer’s perspective will likely give you new insights for improving call performance.
3. Lead Conversion Rate
This metric measures the percentage of customers that end up converting. While call centers may measure many different conversions, this metric is most effective when it tracks large conversions like product or subscription purchases.
Call centers are only effective if they help lead the customer to a course of action. Metrics like call volume and response time help measure efficiency, but lead conversion rate is the ultimate metric for effectiveness and productivity.
Tracking conversion rates can also help call center agents keep themselves focused on the big picture of how their product or service will help their customers. Track lead conversion rates to align agent’s goals with overarching company strategy.
4. Average Call TimeAverage call time, also known as average handle time, is the measure of the average call duration. Call time usually begins when a customer is connected with an agent and ends when the call is disconnected.
When average call times are too long, it can indicate that agents aren’t providing customers with satisfactory solutions in a timely manner. Long call times typically frustrate customers and lead to lower satisfaction rates.
If average call times are too short, it could mean that agents aren’t equipped with the knowledge necessary to provide effective customer service. If this is the case, it’s a good idea to use other metrics, especially customer satisfaction, to find an optimal call time to shoot for.
5. Percentage of Calls Blocked
This metric measures the percentage of calls that fail to connect with customers. While this could be a result of many things, it is often the result of spam filtering and spoofing. If a high percentage of outbound calls are being blocked, it could be an indication that your caller reputation is low.
If you notice you are having a high percentage of calls being blocked, you may consider getting a free caller reputation analysis.
6. Average Abandonment Rate
Abandonment rate, or call abandonment, refers to the percentage of callers who disconnect their call before they are connected to an agent. Customers form perceptions of call centers long before they get a chance to actually speak to an agent. If a caller has to wait a long time before they’re connected, they will likely become frustrated and hang up.
If you have a high average abandonment rate, look for things your agents can do to get to the phone more quickly. It may be helpful to establish benchmarks for both abandonment rate and response time so that agents have a greater sense of responsibility in this area.
7. Average Response Time
Average response time is directly related to the average abandonment rate, but focused on the agent’s perspective rather than the customer’s. Response time is the measurement of the time it takes for an agent to pick up the phone after a caller dials.
This metric is valuable because it shows how quickly agents are trying to connect with customers. If your average abandonment rate is high, the best way to lower it is to first lower average response times.
8. Call Drop Rate
This call metric helps monitor the technical health of your call center. Call drop rate is calculated by dividing the number of calls dropped (due to technical failures) by total calls. For call centers with a strong network connection, this tends to be less of an issue, but keep an eye on this metric if you are a new call center or if you’ve recently changed to a new network.
9. Call Volume
Call volume—a simple but insightful metric—measures the total amount of calls made in a given day. Depending on what kind of contact center you run, these may be inbound or outbound calls. It can be helpful to establish benchmark goals of number of calls for agents to work towards to keep them motivated throughout the workday.
Be careful to not focus too much on call volume as a measure of quality. If, for example, your average call volume in the month of June was 400, don’t assume that conversions or customer satisfaction will increase automatically if the average call volume were to raise to 500. Help agents push themselves by incrementally increasing this number, but remember that a variety of factors influence this metric, including working hours, organization type and number of total agents working in a given shift.
10. Sales-Per-Agent
Sales-per-agent measures the number of sales closed by a single agent in a day, then averages that number across the entire call center. This is a powerful metric to track alongside other call metrics, like total daily sales, for two main reasons:
First, tracking sales-per-agent helps call center managers identify which agents are performing exceptionally well and which agents require additional training. Managers can then focus their attention on low-performing agents.
Second, this metric provides a fantastic opportunity for team cohesion. In sales meetings, managers can show this metric and can ask the entire team to stretch themselves by increasing their daily average sales. Sales-per-agent is the perfect metric to help individual agents see how their efforts are contributing to the company’s overall sales goals.
How Does Hiya Support the Customer Service Matrix?
If you are a call center manager, you know how important it is to always know how your agents are performing. Whether you are seeing growth or not, it can be difficult to know what next step to take to improve call center performance.
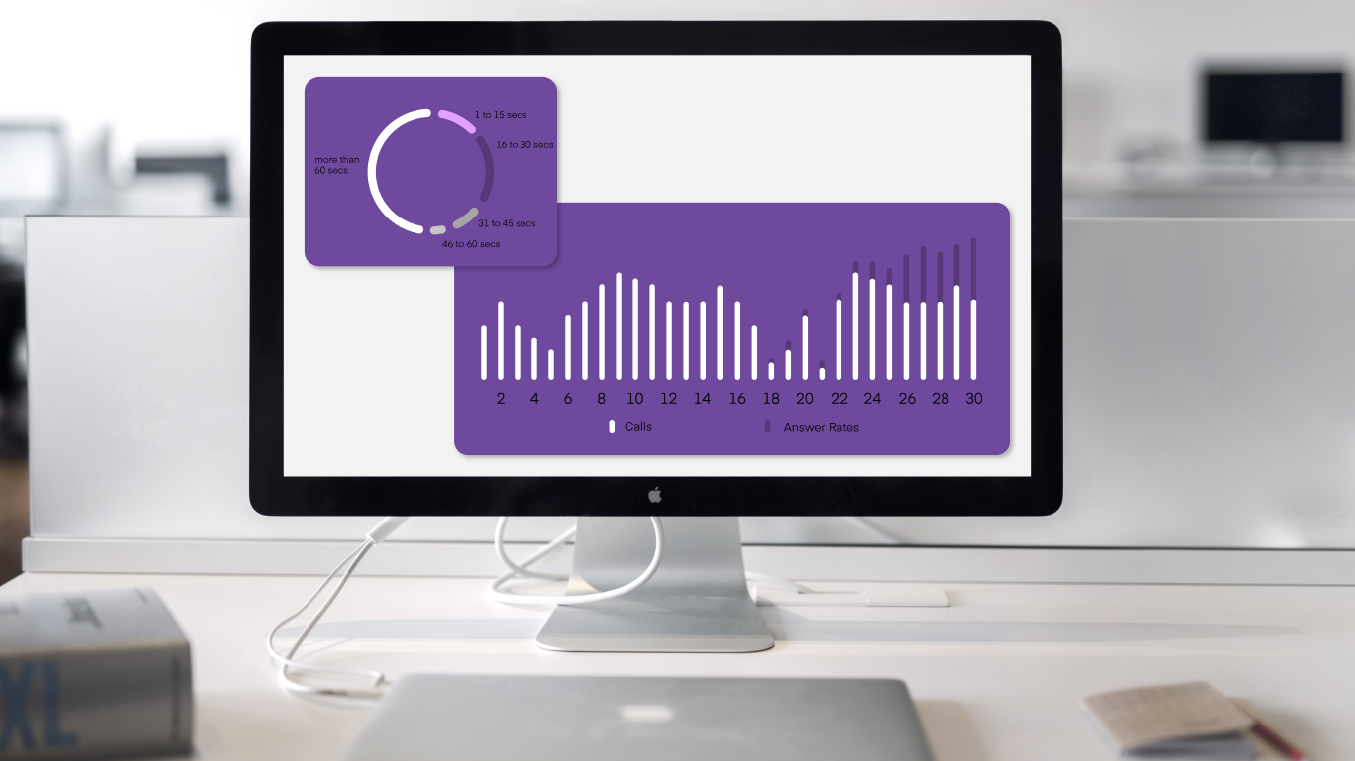
At Hiya, we want to help you discover actionable insights to help you always make good decisions. Our Hiya Connect Console provides you with the full call center matrix, including self-serve dashboards to keep your most important KPIs in one place, daily analytics to see performance trends, and actionable insights to help your agents improve their call performance.
For more information on specific tactics that can help you improve some of these metrics, download our Beyond Caller ID eBook.